Toshiba's XG6 M.2 NVMe drive has been designed for the OEM market, destined to be installed into performance laptops, desktop and gaming PCs. However, the most important thing about the drive is that XG6 is the first SSD to use 96-layer 3D TLC NAND. The XG6 family consists of three capacities; 256MB, 512MB and the flagship 1TB drive we are reviewing here. The drives use the latest Toshiba 96-Layer BiCS4 3D TLC NAND which is looked after by a Toshiba TC58NCP090GSB 8-channel controller, the same one that's used by the previous generation XG5 drive which uses 64-layer 3D TLC NAND. Toshiba quote performance figures for the 1TB XG6 of up to 3,180MB/s for Sequential reads and up to 3,000MB/s for Sequential writes. 4K random performance is quoted as up to 355,000 IOPS for reads and 365,000 IOPS for writes. There's no mention of the drives endurance on the specification sheet at the time of writing, but Toshiba back the drive with a 5-year warranty. Physical Specifications: Usable Capacities: 1TB NAND Components: Toshiba 96-layer BiCS4 3D TLC. NAND Controller: Toshiba TC58NCP090GSB (8-channel). Cache: 512MB LDDDR3. Interface: PCIe 3.1 x4 (NVMe 1.3a). Form Factor: M.2 2280. Dimensions: 22 x 80 x 2.23 mm. Weight: 7.3g Firmware Version: AGXA4001 Toshiba's XG6 is built on a single sided M.2 2280 format. The label on top of the components is unusually thick which makes you think that it may contain a cooling aid such as a copper layer - it doesn't, it's just a thick label. The 1TB XG6 uses two NAND packages each containing eight 512Gb BiCS4 3D TLC dies. Next to these on the PCB sit the TC58NCP090GSB 8-channel controller and a 512MB Nanya LPDDR3 cache IC. For testing, the drives are all wiped and reset to factory settings by HDDerase V4. We try to use free or easily available programs and some real world testing so you can compare our findings against your own system. This is a good way to measure potential upgrade benefits. Main system: Intel Core i7-7700K with 16GB of DDR4-3200 RAM, Sapphire R9 390 Nitro and an Asus Prime Z270-A motherboard. Other drives: Corsair Force MP500 480GB Corsair Force MP510 960GB Intel Optane SSD900P 480GB Intel Optane SSD905P 480GB Intel SSD760p 512GB Kingston A1000 480GB Plextor M9Pe(Y) 512GB Plextor M8PeG 512GB PNY CS2030 240GB Samsung SSD970 EVO 2TB Samsung SSD970 PRO 1TB Samsung SSD960 PRO 2TB Samsung SSD960 EVO 1TB Toshiba OCZ RD400 512GB Western Digital Black NVMe 1TB Western Digital Black PCIe 512GB Software: ATTO Disk Benchmark 3.5. CrystalDiskMark v6 ASSD v2.0 IOMeter. Futuremark PC Mark 8 All our results were achieved by running each test five times with every configuration this ensures that any glitches are removed from the results. Trim is confirmed as running by typing fsutil behaviour query disabledeletenotify into the command line. A response of disabledeletenotify =0 confirms TRIM is active. CrystalDiskMark is a useful benchmark to measure theoretical performance levels of hard drives and SSD’s. We are using v6.0. When tested at a queue depth of 32 using CrystalDiskMark the performance of the XG6 lags behind all the other drives we've tested in both read and writes. However testing the drive at a QD of 1 which is much more like the level it will face in real life, the drive performs reasonably well. The ATTO Disk Benchmark performance measurement tool is compatible with Microsoft Windows. Measure your storage systems performance with various transfer sizes and test lengths for reads and writes. Several options are available to customize your performance measurement including queue depth, overlapped I/O and even a comparison mode with the option to run continuously. Use ATTO Disk Benchmark to test any manufacturers RAID controllers, storage controllers, host adapters, hard drives and SSD drives and notice that ATTO products will consistently provide the highest level of performance to your storage. We are using version 3.5 for our NVMe disk tests. Toshiba quote Sequential performance figures for the 1TB XG6 as up to 3,180MB/s and 3,000MB/s for reads and writes respectively. Using the ATTO benchmark we were able to squeeze a wee bit more read performance out of the drive at 3,255MB/s while writes came in at 3,026MB/s. AS SSD is a great free tool designed just for benching Solid State Drives. It performs an array of sequential read and write tests, as well as random read and write tests with sequential access times over a portion of the drive. AS SSD includes a sub suite of benchmarks with various file pattern algorithms but this is difficult in trying to judge accurate performance figures. We are using the 2.0 version for NVMe drive testing. The 1774 read and 1935 write scores in ASSSD place the drive firmly in the middle of the pack of the NVMe drives we have tested. IOMeter is another open source synthetic benchmarking tool which is able to simulate the various loads placed on hard drive and solid state drive technology. There are many ways to measure the IOPS performance of a Solid State Drive, so our results will sometimes differ from manufacturer’s quoted ratings. We do test all drives in exactly the same way, so the results are directly comparable. We test 128KB Sequential read and write and random read and write 4k tests. The test setup’s for the tests are listed below. Each is run five times. 128KB Sequential Read / Write. Transfer Request Size: 128KB Span: 8GB Thread(s): 1, Outstanding I/O: 1-32 Test Run: 20 minutes per test. 4K Sustained Random Read / Write. Transfer Request Size: 4KB Span: 80GB Thread(s): 4, Outstanding I/O: 1-32 Test Run: 20 minutes per test. 4K Random 70/30 mix Read/Write. Transfer Request Size: 4KB Span: 80GB Reads: 70% Writes: 30% Thread(s): 4 Outstanding I/O: 2 – 32 Test Run: 20 minutes. 128KB Sequential Performance When tested with our 128KB Sequential tests, the drive produced a peak read figure of 3,253.88MB/s while writes peaked at 3,188.37MB/s before dropping back towards the end of the test run. 128KB Sequential Read Performance v QD At a queue depth of 1, the XG6 doesn't perform that well but it soon picks up performance through QD's 2 and 4. It also performs well at a deeper queue depth of 32. 128KB Sequential Write Performance v QD When it comes to Sequential write performance, the XG6 shows a good degree of consistency through the tested queue depth range. At a QD of 32 it just manages to take over the top spot on the chart from the Corsair Force MP510. 4K Random Read v QD Performance Toshiba quote a 4K random read performance figure of up to 355,000 IOPS for the XG6, a figure we fell just shy of under testing, the review drive producing a maximum of 349,840 IOPS. The drive's performance at a deeper queue depth of 32 is much more impressive than at shallower queue depths. 4K Random Write v QD Performance Under our 4K random write tests, the XG6 displays a real drop in performance at queue depths 8 and 32. The maximum IOPS figure we got from the drive was 237,449 IOPS which is a fair way off the official figure of 365,000 IOPS. The random write performance of the drive improves in queue depths 2 and 4 compared to the relatively low IOPS figures at QD1 and QD32. 4K 70/30 Mixed Performance 
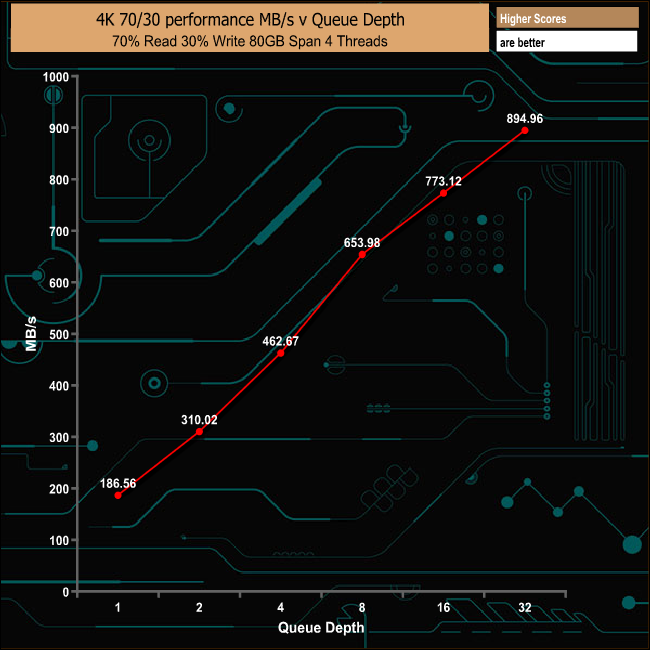
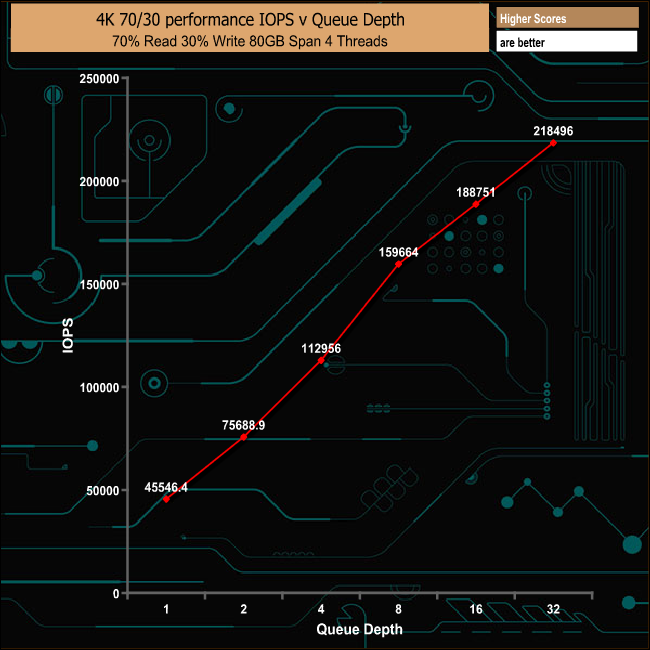
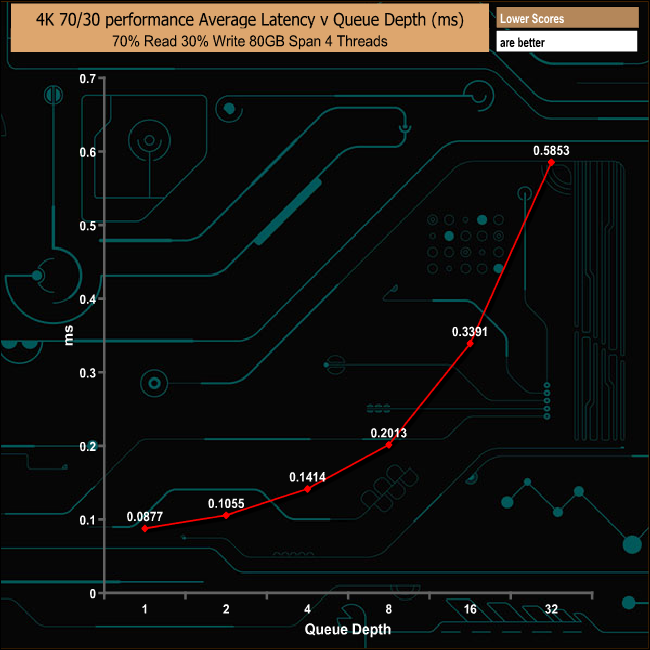
Toshiba's XG6 drive displays strong performance throughout the tested queue depth range in our mixed 70/30 read/write tests. In our throughput tests, the XG6 peaked at the 2MB block mark at 2,599MB/s, a fair way short of the official maximum read figure of 3,180MB/s. As with the read throughput test, the write test saw the drive peak at the 2MB block size at 2,717.53MB/s before the performance dropped off sharply at the 4MB block size to finish the test run at 1,536.80MB/s. Futuremark’s PCMark 8 is a very good all round system benchmark but it’s Storage Consistency Test takes it to whole new level when testing SSD drives. It runs through four phases; Preconditioning, Degradation, Steady State, Recovery and finally Clean Up. During the Degradation, Steady State and Recovery phases it runs performance tests using the 10 software programs that form the backbone of PCMark 8; Adobe After Effects, Illustrator, InDesign, Photoshop Heavy and Photoshop Light, Microsoft Excel, PowerPoint, Word, Battlefield 3 and World of Warcraft. With some 18 phases of testing, this test can take many hours to run. Preconditioning The drive is written sequentially through up to the reported capacity with random data, write size of 256 × 512 = 131,072 bytes. This is done twice. Degradation Run writes of random size between 8 × 512 and 2048 × 512 bytes on random offsets for 10 minutes. It then runs a performance test. These two actions are then repeated 8 times and on each pass the duration of random writes is increased by 5 minutes. Steady State Run writes of random size between 8 × 512 and 2048 × 512 bytes on random offsets for final duration achieved in degradation phase. A performance test is then run. These actions are then re-run five times. Recovery The drive is idled for 5 minutes. Then a performance test is run. These actions are then repeated five times. Clean Up The drive is written through sequentially up to the reported capacity with zero data, write size of 256 × 512 = 131,072 bytes. Although the XG6 suffers throughout the Degradation and Steady State stages of PCMark 8's Consistency test overall, it does recover very well from the ordeal. PCMark 8’s Consistency test provides a huge amount of performance data, so here we’ve looked a little closer at how the1TB Toshiba XG6 performs in each of the benchmarks test suites. Adobe Creative Cloud Overall the drive doesn't handle the rigours of the Adobe CC tests runs very well. Having said that the performance through the recovery phases of the two Photoshop (Light and Heavy) traces is very good. Microsoft Office In the Microsoft Office part of the Consistency test it is usually the Word test trace that causes a drive problems but the XG6 isn't troubled too much by it. However overall the recovery performance for this test suite is a bit erratic. Casual Gaming The drive gets hit hard in both casual gaming tests but the recovery of the drive for both tests is very impressive. Just like the Consistency test, PCMark 8’s Standard Storage test also saves a large amount of performance data. The default test runs through the test suite of 10 applications three times. Here we show the total bandwidth performance for each of the individual test suites for the third and final benchmark run. The drive produces some strong bandwidth figures in the last run of PCMark 8's Standard Storage test. For the long term performance stability test, we set the drive up to run a 20-minute 4K random test with a 30% write, 70% read split, at a Queue Depth of 256 over the entire disk. The 1TB Toshiba XG6 averaged 78,661 IOPS for the test with a performance stability of 66.2%. To test real life performance of a drive we use a mix of folder/file types and by using the FastCopy utility (which gives a time as well as MB/s result) we record the performance of drive reading from & writing to a 256GB Samsung SSD850 PRO. 100GB data file. 60GB iso image. 60GB Steam folder – 29,521 files. 50GB File folder – 28,523 files. 12GB Movie folder – 24 files (mix of Blu-ray and 4K files). 10GB Photo folder – 621 files (mix of png, raw and jpeg images). 10GB Audio folder – 1,483 files (mix of mp3 and .flac files). 5GB (1.5bn pixel) photo. The XG6 deals with the large file sizes in our real life file transfer tests very efficiently, much more so than the small files that make up the 50GB file, 60GB Steam and 10GB Audio folder transfers. To get a measure of how much faster PCIe NVMe drives are than standard SATA SSD's we use the same files but transfer to and from a 512GB Toshiba OCZ RD400. It's the same story with the NVMe to NVMe transfer tests with the drive handling larger files much more easily than the small ones. Best performances from this test came from the 5GB Photo transfer (2,551MB/s) and the 12GB Movie Folder (2,544MB/s). Toshiba's XG6 M.2 NVMe drive has been designed for the OEM market, destined to be installed into performance laptops, desktop and gaming PCs. Toshiba also envisage the drive being used as boot drives in servers, caching and logging, and commodity storage in datacenters. The most important facet of the drive is the NAND it uses, namely Toshiba's latest 96-layer BiCS4 3D TLC NAND. The XG6 is first SSD launched using this type of flash. With 96-layers enabling 512Gbit dies, the new NAND offers a 40% increase in capacity over the previous generation of Toshiba 64-layer NAND. It also supports the Toggle 3.0 standards which boosts the interface speed from the 400 - 533 MT/s of Toggle 2.0 up to 667 - 800MT/s. Performance wise Toshiba quote Sequential figures for the 1TB XG6 of up to 3,180MB/s for reads and up to 3,000MB/s for writes. Using the ATTO benchmark we were able to confirm those figures with the review drive producing a read figure of 3,255MB/s and writes of 3,026MB/s. With our own 128KB Sequential tests the drive produced peak figures of 3,253.88MB/s and 3,188.37MB/s for reads and writes respectively. The random performance of the drive is quoted as up to 355,000 IOPS for reads and 365,000 IOPS for writes. Under testing the best random read figure we got from the drive was 349,840 IOPS, a little short of that maximum figure. Writes on the other hand fell way short of the maximum figure, the best we got from testing was 237,449 IOPS. The XG6 is currently an OEM product at the moment so it may well turn up in the next notebook you buy. It will, in all probability form the basis of the next generation of Toshiba NVMe drives to hit the market and the NAND itself, no doubt will be seen in other SSD's in the very near future. Pros 96-Layer 3D TLC NAND. Overall performance. Cons OEM drive only at the time of writing. Kitguru says: Although the XG6 is an OEM part at present, we are pretty sure it will form the basis of the next series of retail consumer NVMe SSDs that Toshiba will roll out.